HD² Observations
Observation Strategy and Status
Survey Region
The HD² survey targets a contiguous ~100 deg² region at declination ~43°, selected for its low zenith angle at FAST (<26.4°, ensuring optimal aperture efficiency) and reduced RFI contamination compared to equatorial fields. The field lies within the DESI DR1 footprint and overlaps with HSC-SSP wide-field imaging in its northern portion.
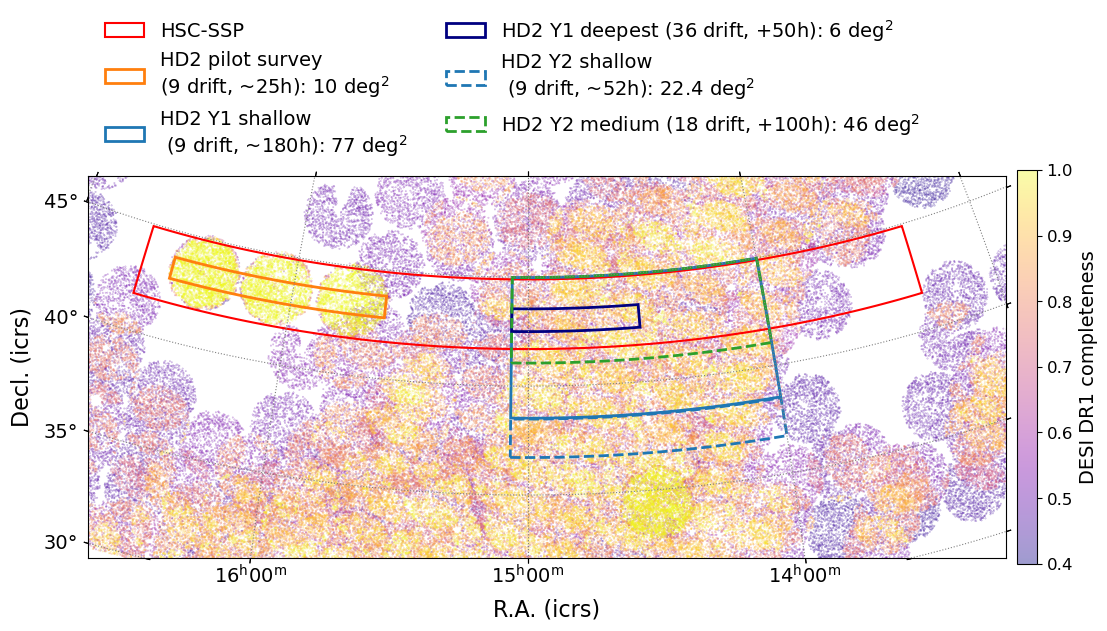
Figure: Sky distribution of HD² survey fields overlaid on DESI DR1 spectroscopic completeness (yellow = completeness ~1.0; purple = ~0.4). Red box: HSC-SSP wide field. Orange: Pilot Survey (10 deg²). Blue solid: Y1+Y2 wide (100 deg²). Dark blue solid: Y1 deep (5 deg²). Green dashed: Y2 medium-deep (46 deg²). (Credit: Xu, Chen 2026)
Observation Status
| Milestone | Area | Cumulative Depth (drift scan passes) |
Status | Period |
|---|---|---|---|---|
| Pilot Survey | 10 deg² | 9 passes (~7.3 min/beam) | Complete | Jul–Aug 2023 |
| Y1 Wide | 77 deg² | 9 passes (~7.3 min/beam) | Complete | Aug 2024 – Apr 2025 |
| Y1 Deep | 6 deg² | 36 passes (~29 min/beam) | Complete | May–Jun 2025 |
| Y2 Wide | 23 deg² | 9 passes (~7.3 min/beam) | Y1+Y2 Wide = 100 deg² Complete |
Mar 2026 |
| Y2 Medium-deep | 46 deg² | 18 passes (~14.6 min/beam) | Complete | Mar-Apr 2026 |
| Y3 Medium-deep | 54 deg² | 18 passes (~14.6 min/beam) | Planned | 2027 |
| Full Survey (24+ passes) | 100 deg² | 24+ passes (>20 min/beam) | Planned | Expected 2028 |
Observation Strategy
Scanning Mode
HD² uses the FAST 19-beam receiver in Multibeam On-The-Fly (OTF) mapping mode, scanning in right ascension at 5″ s⁻¹ — approximately one-third of the drift scan speed, so each OTF pass is equivalent to 3 drift scan passes in depth. Each observing session covers a ~4.4 deg² strip over ~3.2 hours, with the zenith angle kept below 26.4° to maintain optimal telescope efficiency. Successive passes are offset in declination by at least 1/6 of the beam spacing to ensure uniform Nyquist sampling. The flux calibrator 3C 286 is observed every 10 days.
Layered Depth Strategy
HD² adopts a tiered observing strategy to balance area coverage and integration depth across its multi-year program:
- Wide tier (9 passes): rms ~ 0.45 mJy beam⁻¹ at 4.8 km s⁻¹ — matches the pilot survey depth, covering the full 100 deg²
- Medium-deep tier (18 passes): rms ~ 0.32 mJy beam⁻¹ — covering ~46 deg² in Year 2
- Deep tier (24+ passes): rms ~ 0.28 mJy beam⁻¹ — full survey target sensitivity over 100 deg², equivalent to ~20 min integration per beam
- Deepest tier (36 passes): rms ~ 0.23 mJy beam⁻¹ — 6 deg² ultra-deep field in Year 1
Calibration
The HD² survey data are processed using the HiFAST pipeline.
- Noise diode calibration: High-power (~10 K) noise diode injected for 2 s every 5 min for antenna temperature calibration, see Jing et al. 2024 (SCPMA) for details.
- Flux Calibration & Gain: Impact of observing modes and ambient temperature on FAST gain, along with standard flux calibration procedures using 3C 286, are presented in Liu et al. 2024 (RAA).
- Baseline and bandpass: Low-order polynomial baseline subtraction per spectrum, followed by MedMed bandpass correction
- RFI flagging: Strong RFI between 1.15–1.30 GHz excluded; shared RFI mask applied across all beams
- Standing Wave & RFI: Methods for removing standing waves and mitigating periodic RFI are described in Xu et al. 2025 (RAA).
Technical Details
| Parameter | Value | Notes |
|---|---|---|
| Telescope | FAST | Five-hundred-meter Aperture Spherical radio Telescope |
| R.A. range | 14h00m00s – 15h04m00s | Full survey coverage |
| Dec. range | 36° 43' 30'' – 45° 00' 00'' | Full survey coverage |
| Receiver / Beams | 19-beam L-band | Cryogenic receiver array |
| Beam size (FWHM) | ~2.9 arcmin | At 1.42 GHz |
| Polarizations | 2 (XX, YY) | Dual polarization |
| Gain | 14 – 16 K Jy⁻¹ | from Liu et al. 2024 |
| System temperature (Tsys) | 19 – 23 K | FAST L-band receiver |
| Full frequency range | 1000 – 1500 MHz | W band backend |
| Full spectral channels | 65,536 | W band backend |
| Redshift range | 0.001 – 0.09 & ~0.3 | HI redshift (low & high) |
| Channel resolution | 7.6 kHz / 22.8 kHz | W band / after down-sample |
| Spectral resolution (z=0) | 1.6 / 4.8 / 10 km s⁻¹ | W band / down-sample / Hann smooth |
| Expected map median rms | 0.28 mJy beam⁻¹ | At 4.8 km s⁻¹ resolution |
| Expected spectral median rms | 0.28 mJy | At 10 km s⁻¹ resolution |
| Grid pixel size | 1 arcmin | Data cube pixelation |
Data Reduction Pipeline
The detailed data reduction procedures and the performance of the pipeline are described in the series of HiFAST publications: Jing et al. 2024 (Paper I), Liu et al. 2024 (Paper II), Xu et al. 2025 (Paper III), and Chen et al. 2026 (Paper IV). The further details on the survey implementation can be found in Xu et al. 2026.